 This example was created to accompany: Human-in-the-Loop Machine Learning by Robert Munro (Manning Publications).
 This example was created to accompany: Human-in-the-Loop Machine Learning by Robert Munro (Manning Publications).
See the book for more details on each Uncertainty Sampling method and for more sophisticated problems than labeling, like predicting sequences of text and semantic segmentation for images. The principles of uncertainty are the same, but the calculations of uncertainty will be different.
The book also covers other Active Learning strategies, like Diversity Sampling, and the best ways to interpret your models' probability distributions (hint: you probably can’t trust the confidence of your model).
Robert Munro, September 2019
Twitter: @WWRob | Github: rmunro
In case you came to this page from somewhere other than from the book, here's a brief overview so that you can interpret and have fun with the heatmaps!
The heatmaps show the four main Uncertainty Sampling algorithms and the different areas that they sample. In this example, assume that each dot is an item with a different label, and the heat of each pixel is the uncertainty. The hottest (most uncertain) pixels are the light red pixels and the coldest (most confident) are dark blue & green.
You can click on any heatmap to add a new label and see the change immediately.
The four types of Uncertainty Sampling algorithms are:
These four algorithms are used to determine where Machine Learning models are confused. They are typically used over thousands or even millions of datapoints per label, but you still get a good intuition for the differences between the algorithms here. They are primarily used for Active Learning, the process of sampling datapoints that confuse a Machine Learning model by being near a decision boundary.
One main take-away is that Margin of Confidence and Ratio of Confidence sample some items that have only pairwise confusion and Entropy maximizes for confusion among all labels. Especially in more complicated tasks, like when you add 10 or more labels above, the items that would be sampled can be very different: 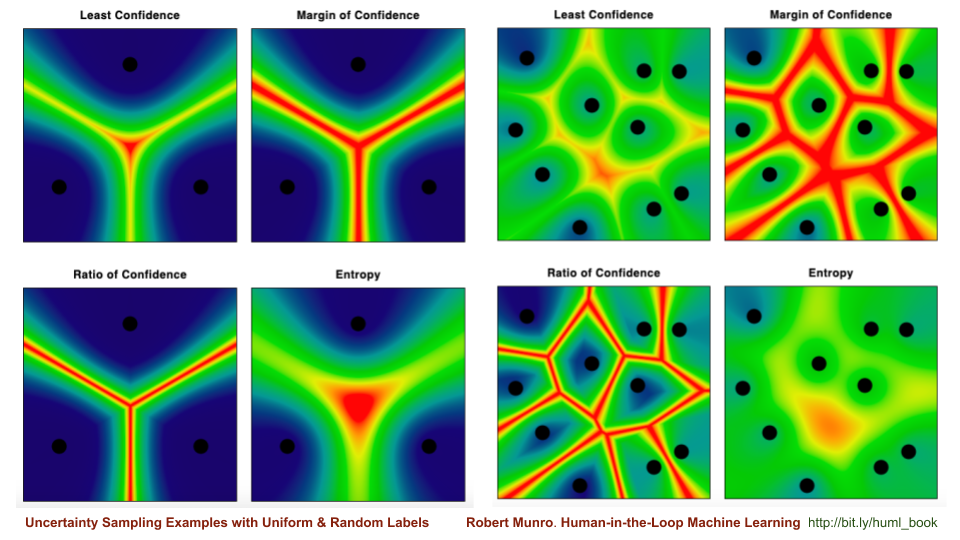
Here's another good example (with thanks to Adrian Calma for suggesting this configuration!). It highlights how the different types of uncertainty can focus on very different parts of the feature space. Margin of Confidence and Ratio of Confidence measures a lot of uncertainty between two of the labels, which is ignored entirely by Entropy because it is not ambiguous for the third label:
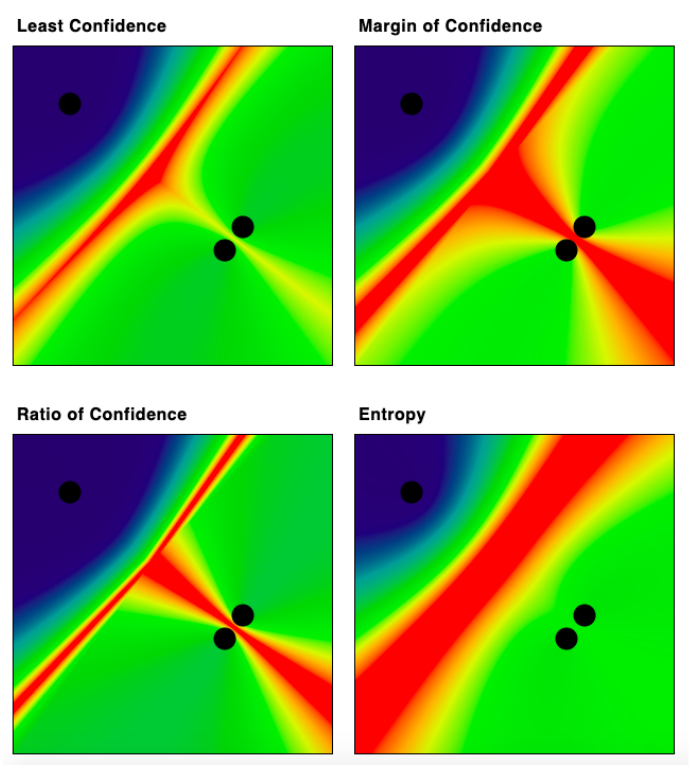
The differences in areas that are interpreted as "uncertain" mean that Data Scientists need to decide which algorithm, or which combination of algorithms, is the best for a specific Machine Learning tasks.
For a little more detail, see an article I wrote on uncertainty sampling: Uncertainty Sampling Cheatsheet. (Towards Data Science)
The heatmaps were inspired by ones in a Literature Review on Active Learning from 2010, which is a great review of early Active Learning research.
I've published versions of the Uncertainty Sampling Cheatsheet paper with the algorithms implemented in NumPy and PyTorch:
The source for this page will give you Javascript implementations of the Uncertainty Sampling algorithms that are powering the heatmaps.
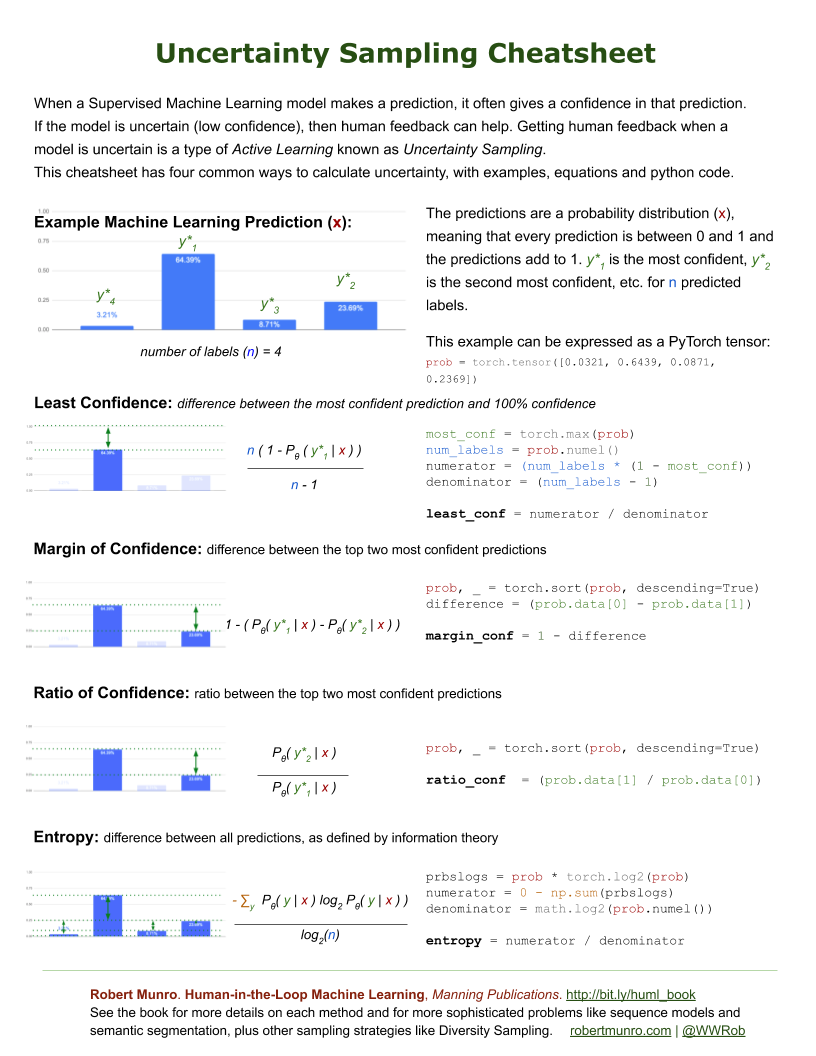
At a glance, here's an image of the PyTorch one, so you can reference each heatmap above with the equation and one implementation: